

Open Analytics
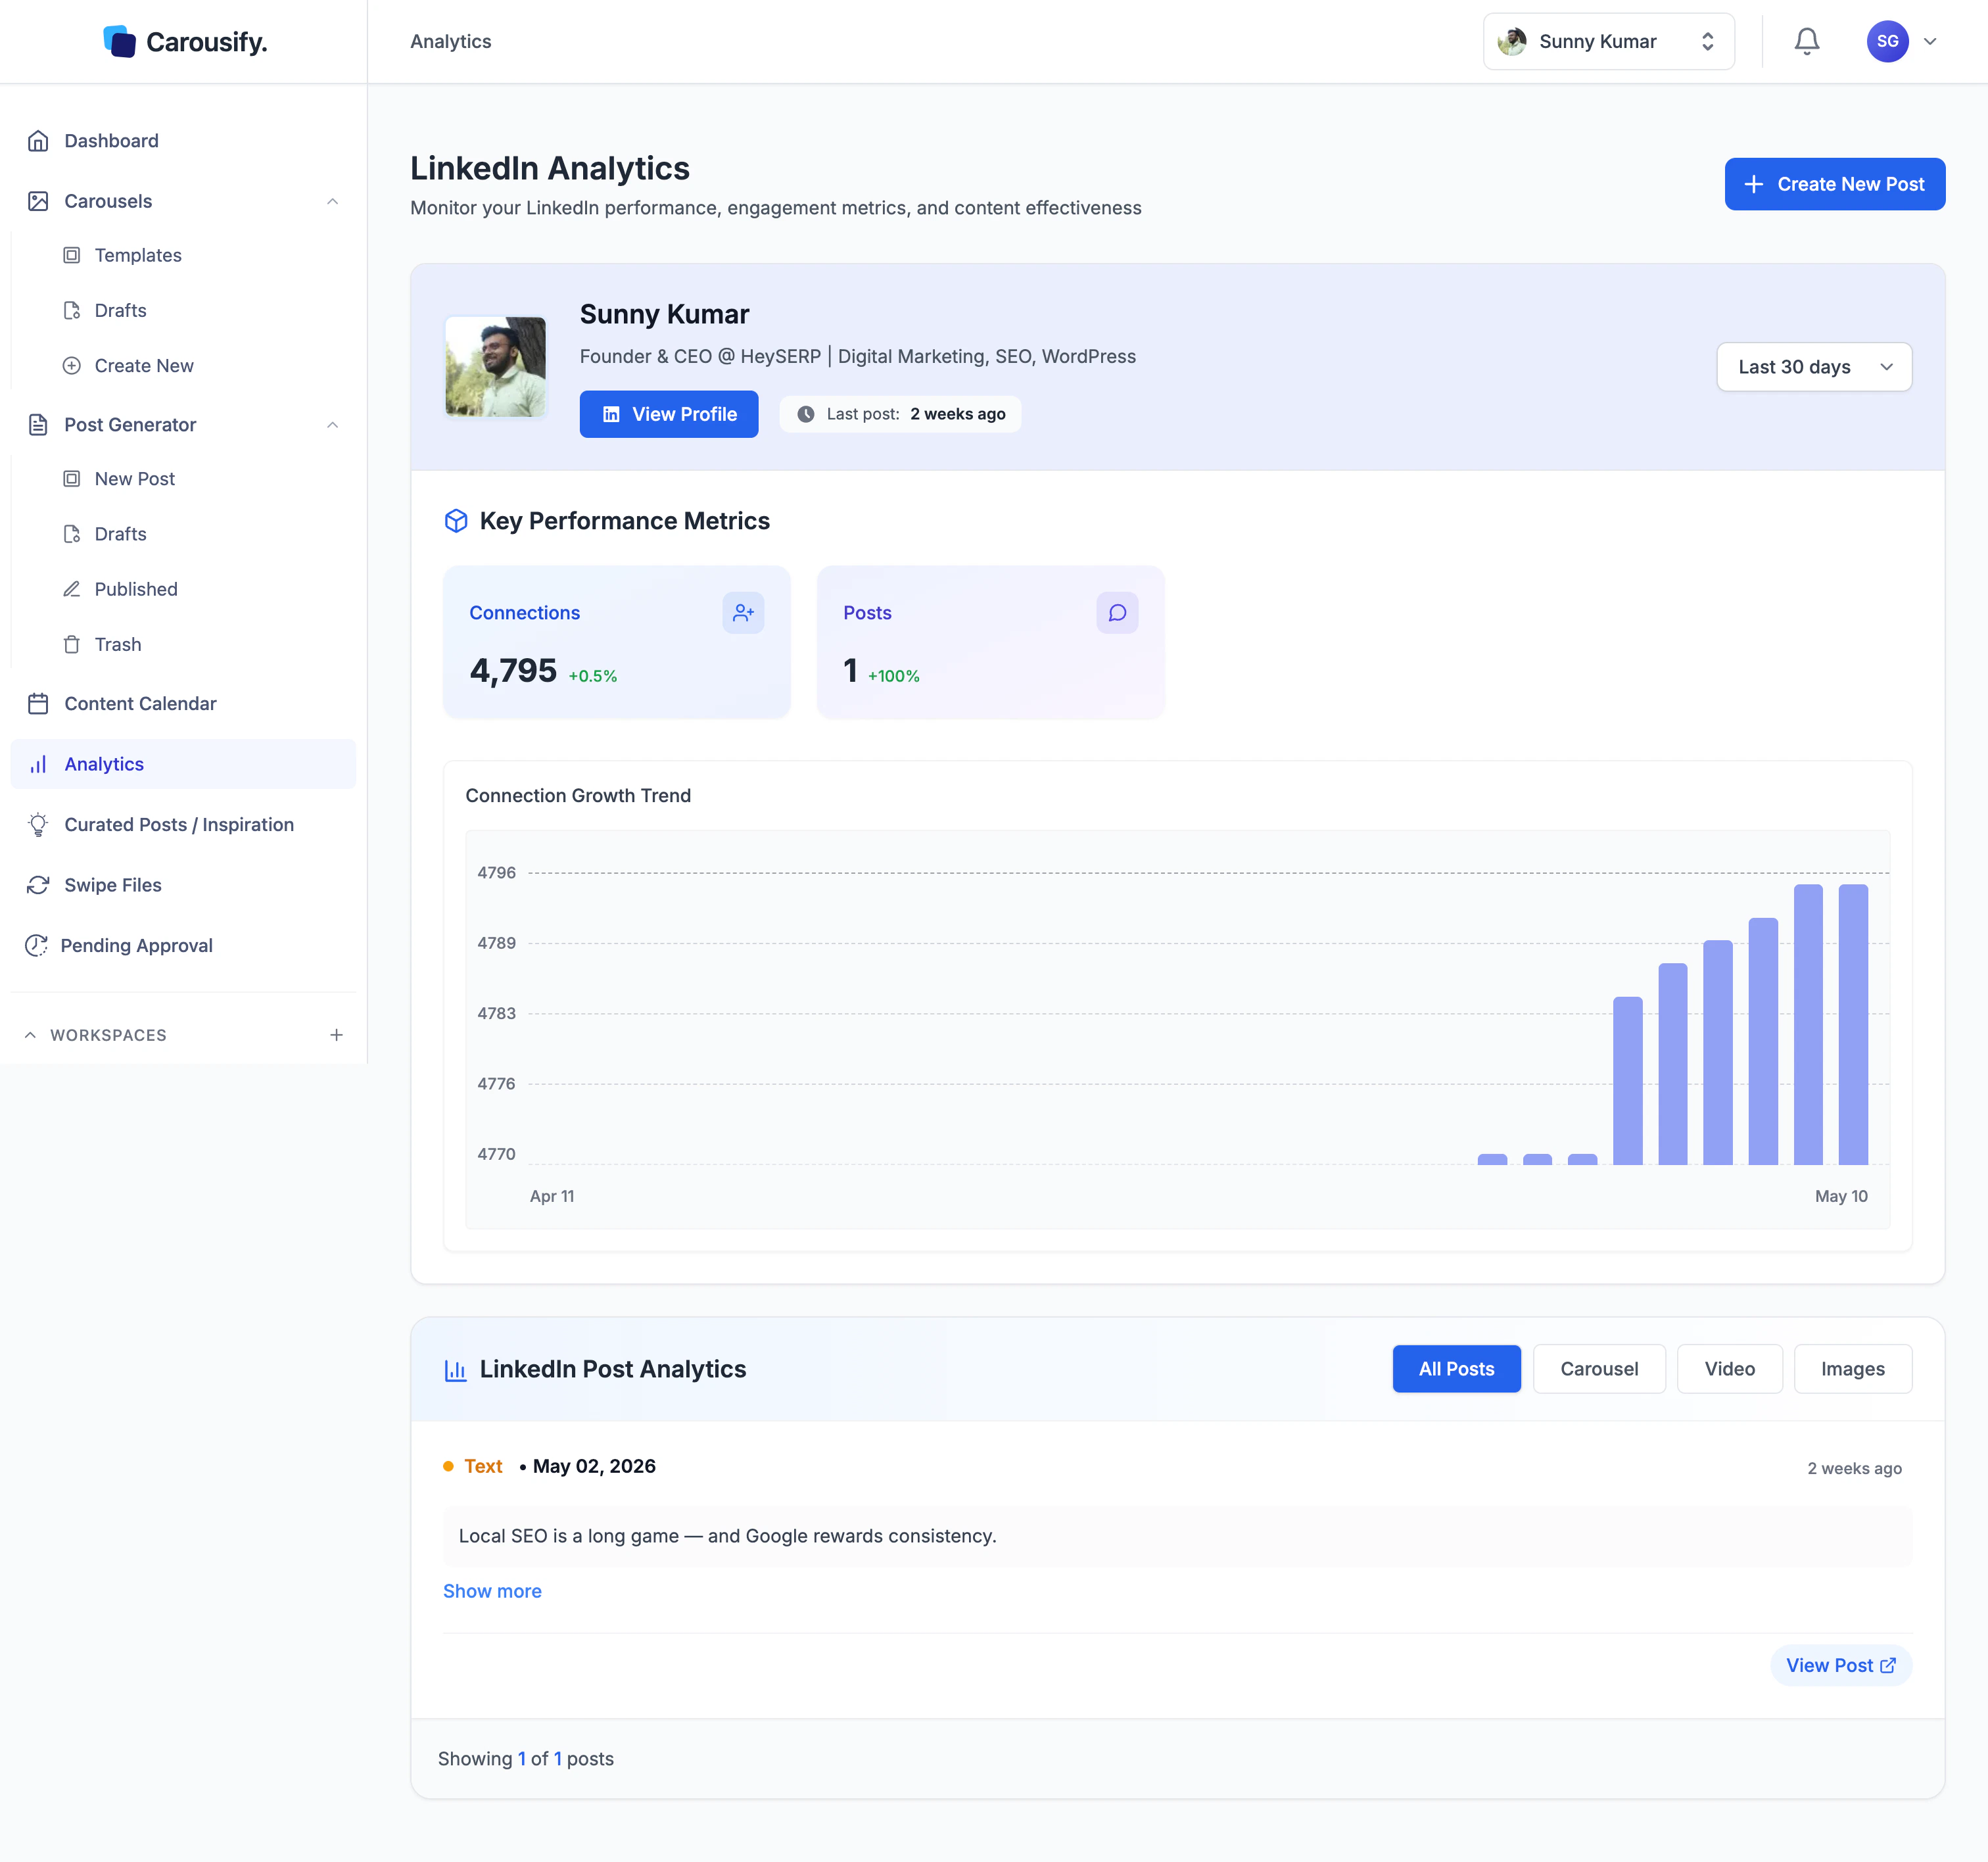
In the left sidebar, click Analytics. The page loads numbers for whichever LinkedIn account is selected in the account picker at the top bar. Switch accounts from that picker any time. Analytics re-fetches everything against the newly selected one.Analytics is scoped to the active workspace and the selected LinkedIn account. Numbers don’t pool across accounts or workspaces — switch the account picker or the workspace to see another set.
Date range
On the right of the top card, the date range dropdown sets the window every number on the page is calculated against:- Last 15 days
- Last 30 days (default)
- Last 90 days
- Last 180 days
Key Performance Metrics
The cards under Key Performance Metrics are calculated against the date range you picked.LinkedIn Post Analytics
The lower section lists every post the account published in the date range, newest first. Each card shows:- Post type —
Text,Carousel,Video, orImages - Publish date plus a relative timestamp (e.g. 2 weeks ago)
- Post body — collapsed by default; click Show more to expand
- Likes and Comments (Pages only) — engagement counts pulled from LinkedIn’s API
- View Post — opens the post on LinkedIn in a new tab
How data refreshes
Carousify syncs with LinkedIn’s API once per day — connection counts, posts, and the trend chart all update on that daily pull. Numbers you see on Analytics are from the most recent sync, not real-time. There’s no manual refresh button; new posts and connection changes show up at the next daily sync. If a connected account ever falls out of sync (LinkedIn token expired, the account was disconnected, etc.), the page shows the last known values and prompts you to reconnect. See Connect your LinkedIn account.What’s next
Link tracking
Shorten outbound links and measure clicks back to your posts.
Schedule a post
Queue more posts at peak times for your timezone.
Content Calendar
See published and scheduled posts side by side.
Curated Posts
Auto-generated post ideas based on the account’s niche.