> ## Documentation Index
> Fetch the complete documentation index at: https://docs.carousify.com/llms.txt
> Use this file to discover all available pages before exploring further.
# LinkedIn Analytics
> Track connection growth, how often you post, and per-post performance across every LinkedIn account in the workspace.
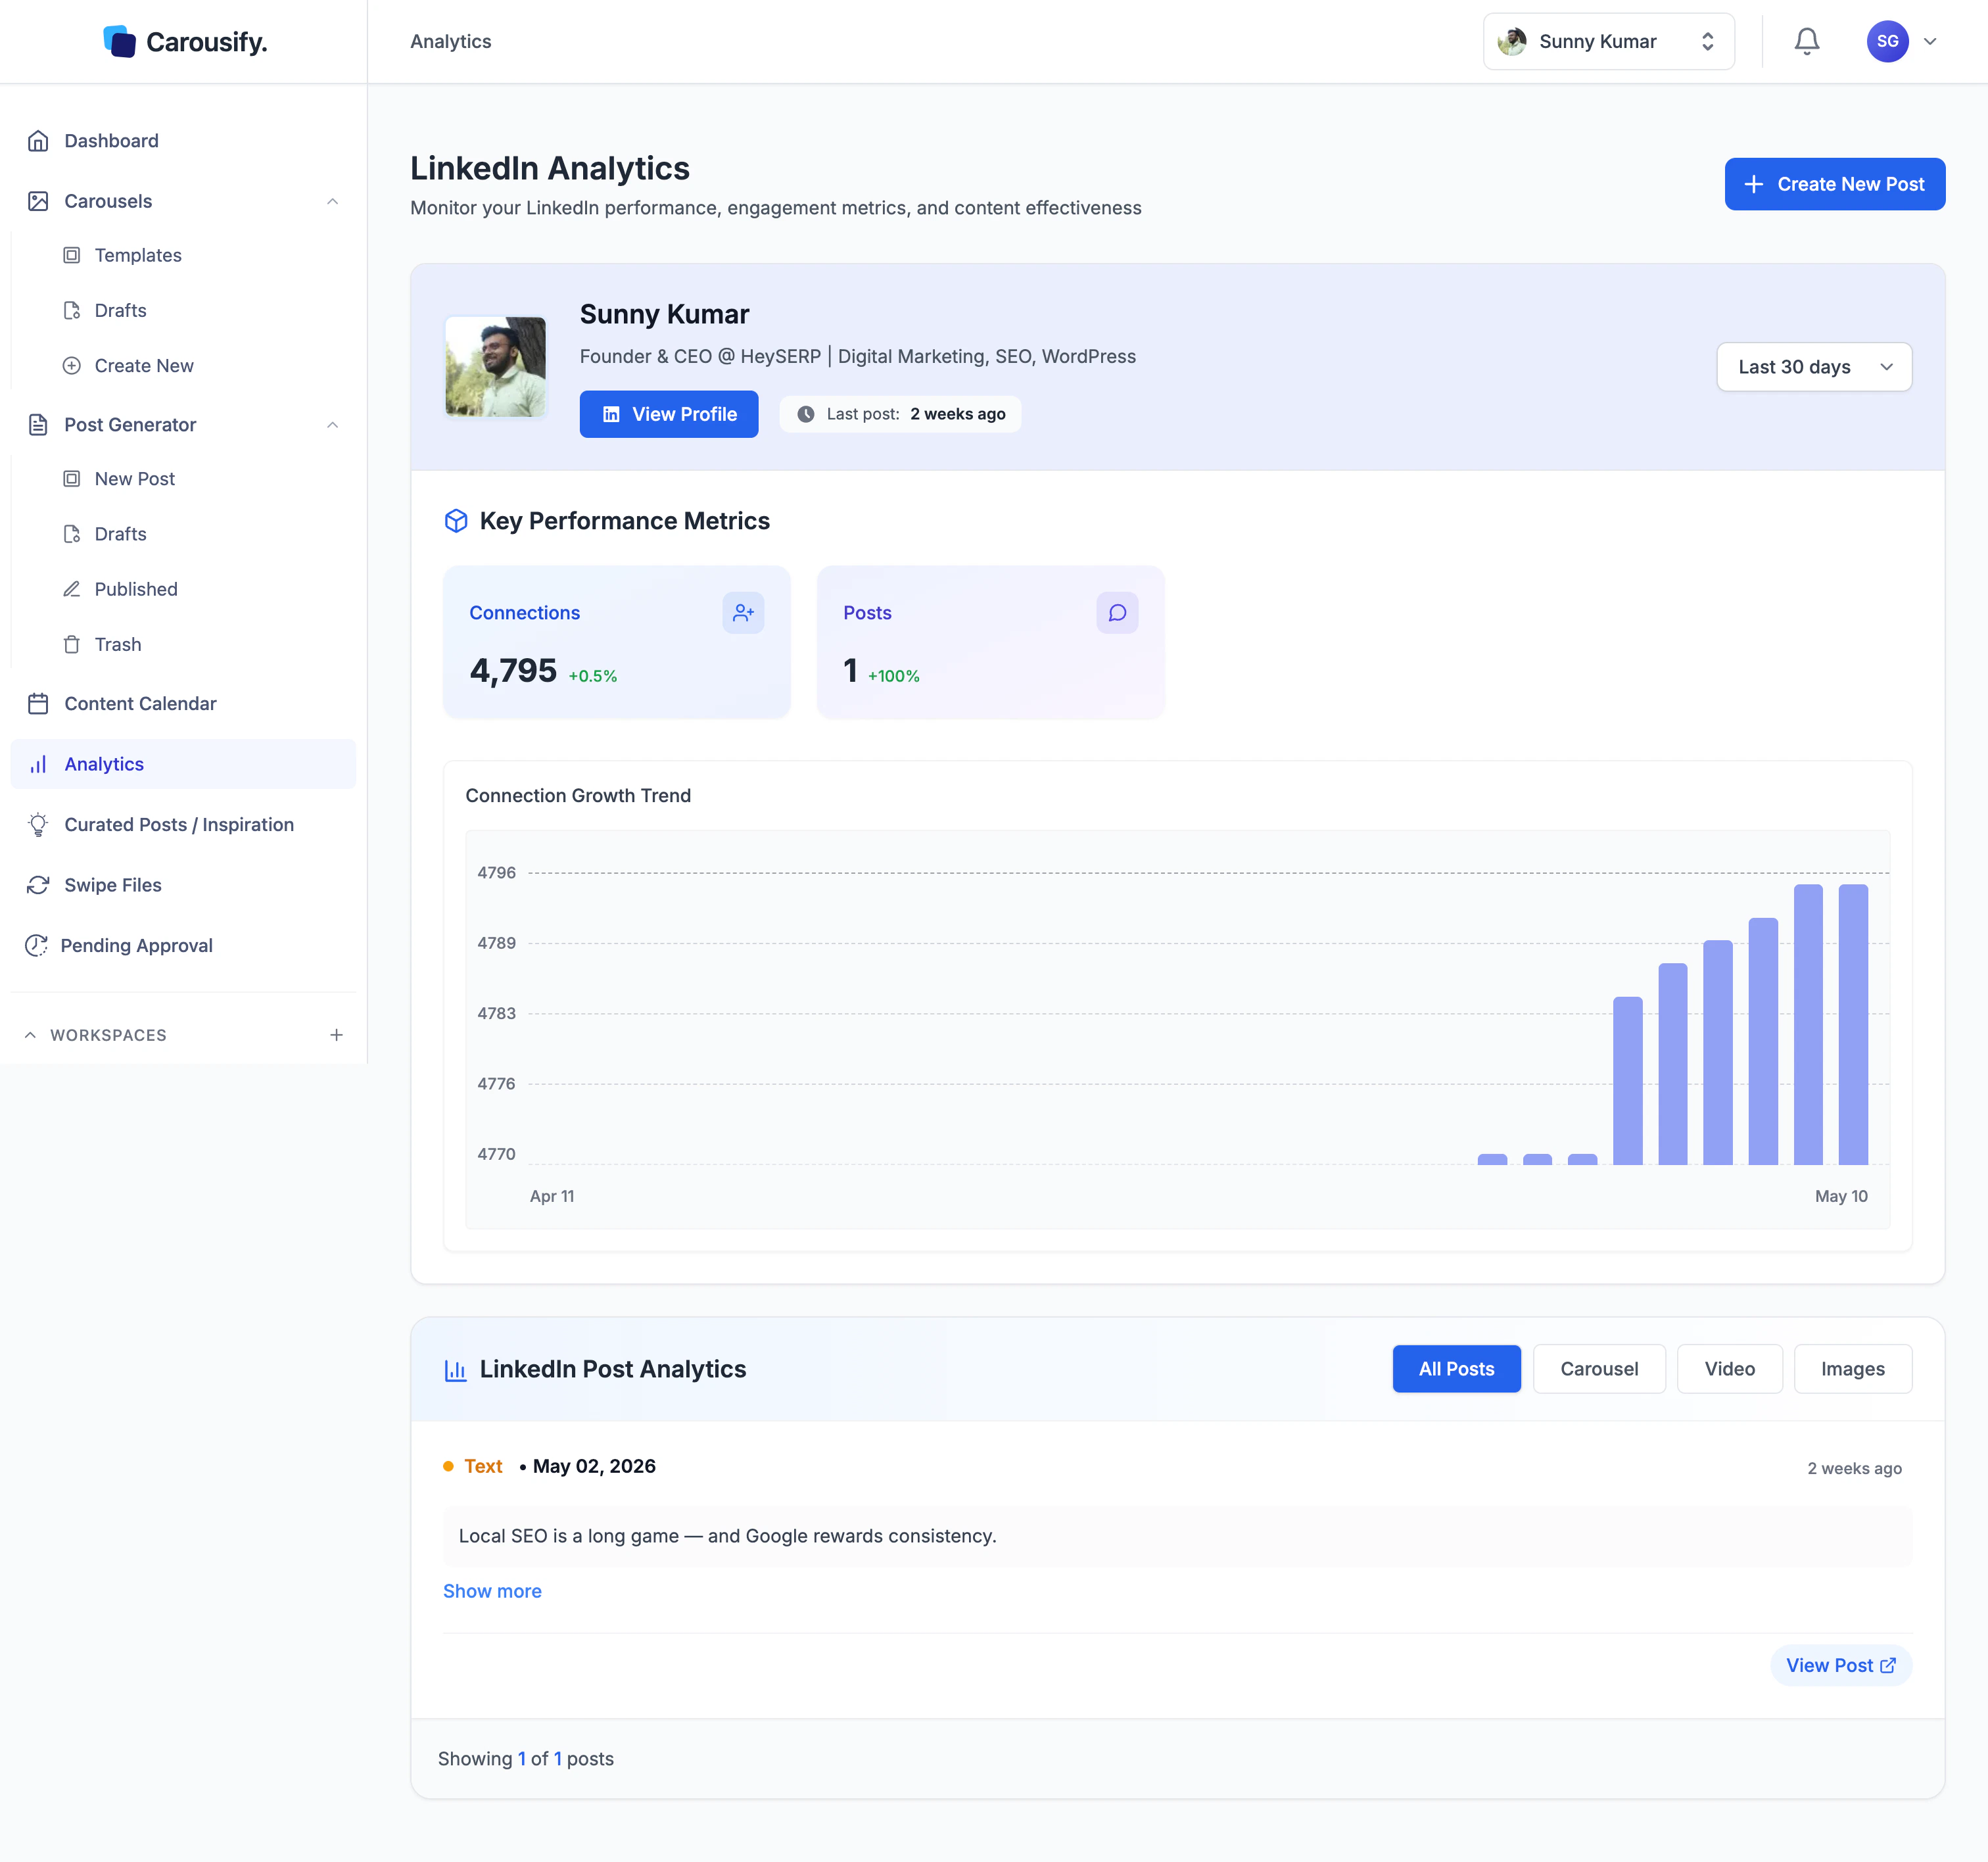
The **Analytics** page is where you check how a LinkedIn account is actually doing — connection growth, posts shipped in the period, and a per-post breakdown for whichever account you pick. Carousify pulls data through LinkedIn's official API for every account connected to the workspace, and refreshes it **once per day**.
 ## Open Analytics
In the left sidebar, click **Analytics**.
The page loads numbers for whichever LinkedIn account is selected in the **account picker** at the top bar.
Switch accounts from that picker any time. Analytics re-fetches everything against the newly selected one.
Analytics is scoped to the **active workspace and the selected LinkedIn account**. Numbers don't pool across accounts or workspaces — switch the account picker or the workspace to see another set.
The top card carries the LinkedIn account you're looking at — avatar, name, headline, a **View Profile** link to the live profile, and a **Last post: X ago** timestamp so you can tell at a glance how stale the queue is.
## Date range
On the right of the top card, the **date range** dropdown sets the window every number on the page is calculated against:
* **Last 15 days**
* **Last 30 days** (default)
* **Last 90 days**
* **Last 180 days**
Change the range and the KPI cards, the connection chart, and the post list all recompute against the new window.
## Key Performance Metrics
The cards under **Key Performance Metrics** are calculated against the date range you picked.
| Metric | What it shows |
| --------------------------- | ------------------------------------------------------------------------------------------------ |
| **Connections** | Total connections on the account right now, with the percentage change over the selected period. |
| **Posts** | Number of posts published in the selected period, with the period-over-period change. |
| **Likes** *(Pages only)* | Per-post likes across every post in the selected period, with the period-over-period change. |
| **Comments** *(Pages only)* | Per-post comments across every post in the selected period, with the period-over-period change. |
## LinkedIn Post Analytics
The lower section lists every post the account published in the date range, newest first.
Each card shows:
* **Post type** — `Text`, `Carousel`, `Video`, or `Images`
* **Publish date** plus a relative timestamp (e.g. *2 weeks ago*)
* **Post body** — collapsed by default; click **Show more** to expand
* **Likes and Comments** *(Pages only)* — engagement counts pulled from LinkedIn's API
* **View Post** — opens the post on LinkedIn in a new tab
The four buttons on the right of the section header — **All Posts**, **Carousel**, **Video**, **Images** — filter the list down to one format at a time. Useful for answering "did my carousels outperform single-image posts this quarter?" without scrolling through the full feed.
## How data refreshes
Carousify syncs with LinkedIn's API **once per day** — connection counts, posts, and the trend chart all update on that daily pull. Numbers you see on Analytics are from the most recent sync, not real-time. There's no manual refresh button; new posts and connection changes show up at the next daily sync.
If a connected account ever falls out of sync (LinkedIn token expired, the account was disconnected, etc.), the page shows the last known values and prompts you to reconnect. See [Connect your LinkedIn account](/getting-started/connect-linkedin#disconnect-or-reconnect).
## What's next
Shorten outbound links and measure clicks back to your posts.
Queue more posts at peak times for your timezone.
See published and scheduled posts side by side.
Auto-generated post ideas based on the account's niche.
## Open Analytics
In the left sidebar, click **Analytics**.
The page loads numbers for whichever LinkedIn account is selected in the **account picker** at the top bar.
Switch accounts from that picker any time. Analytics re-fetches everything against the newly selected one.
Analytics is scoped to the **active workspace and the selected LinkedIn account**. Numbers don't pool across accounts or workspaces — switch the account picker or the workspace to see another set.
The top card carries the LinkedIn account you're looking at — avatar, name, headline, a **View Profile** link to the live profile, and a **Last post: X ago** timestamp so you can tell at a glance how stale the queue is.
## Date range
On the right of the top card, the **date range** dropdown sets the window every number on the page is calculated against:
* **Last 15 days**
* **Last 30 days** (default)
* **Last 90 days**
* **Last 180 days**
Change the range and the KPI cards, the connection chart, and the post list all recompute against the new window.
## Key Performance Metrics
The cards under **Key Performance Metrics** are calculated against the date range you picked.
| Metric | What it shows |
| --------------------------- | ------------------------------------------------------------------------------------------------ |
| **Connections** | Total connections on the account right now, with the percentage change over the selected period. |
| **Posts** | Number of posts published in the selected period, with the period-over-period change. |
| **Likes** *(Pages only)* | Per-post likes across every post in the selected period, with the period-over-period change. |
| **Comments** *(Pages only)* | Per-post comments across every post in the selected period, with the period-over-period change. |
## LinkedIn Post Analytics
The lower section lists every post the account published in the date range, newest first.
Each card shows:
* **Post type** — `Text`, `Carousel`, `Video`, or `Images`
* **Publish date** plus a relative timestamp (e.g. *2 weeks ago*)
* **Post body** — collapsed by default; click **Show more** to expand
* **Likes and Comments** *(Pages only)* — engagement counts pulled from LinkedIn's API
* **View Post** — opens the post on LinkedIn in a new tab
The four buttons on the right of the section header — **All Posts**, **Carousel**, **Video**, **Images** — filter the list down to one format at a time. Useful for answering "did my carousels outperform single-image posts this quarter?" without scrolling through the full feed.
## How data refreshes
Carousify syncs with LinkedIn's API **once per day** — connection counts, posts, and the trend chart all update on that daily pull. Numbers you see on Analytics are from the most recent sync, not real-time. There's no manual refresh button; new posts and connection changes show up at the next daily sync.
If a connected account ever falls out of sync (LinkedIn token expired, the account was disconnected, etc.), the page shows the last known values and prompts you to reconnect. See [Connect your LinkedIn account](/getting-started/connect-linkedin#disconnect-or-reconnect).
## What's next
Shorten outbound links and measure clicks back to your posts.
Queue more posts at peak times for your timezone.
See published and scheduled posts side by side.
Auto-generated post ideas based on the account's niche.